|
Mizunami Underground Research Laboratory Project
Results from 1996-1999 Period
|
| 4. Main results of the Phase I-a |
| 4.2 Hydrogeological investigations |
| 4.2.3 Groundwater flow simulation (2nd analysis loop) |
1) Overview
A groundwater flow simulation (2nd analysis loop) is carried out on the basis of the results of borehole investigations in three 1,000m-class boreholes (MIU-1 3), reflection seismic survey, and so on. The borehole investigations consist of following items.
 core description and BTV investigations to acquire detailed information on fracture zones presumed to form water channels in the granite
hydraulic tests in every 100m-long sections to understand comprehensive hydraulic properties throughout the boreholes
hydraulic tests in every several-m-long sections to understand hydrogeological properties of the water channels.
Based on the results of the above-mentioned investigations, geological units are extracted (See Chapter 4.1.4) and their hydrogeological properties are examined. As a result, the followings are made clear.
 The "Upper fracture zone" and "Fracture zone along the fault" have high permeability, whereas the "Moderately fracture zone" has low permeability;
 The water level on the footwall side of the Tsukiyoshi Fault is 20m higher than that on the hanging wall side. It suggests that the fault functions as an impervious wall.
Based on the above-mentioned results, groundwater flow simulation in the 2nd analysis loop (study area: ca.4km ca.6km) is carried out with the purpose of understanding changes in hydrogeological properties caused by the shaft excavation, verifying the effects of the fault, and examining whether it is necessary to take permeable fractures into consideration.
In the 2nd analysis loop, the following six subjects are extracted to be examined in the construction of the hydrogeological model and the groundwater flow simulation.
Method of setting the geological units for geological model
Varieties, quality and quantity of data needed for modeling of the geological model and the groundwater flow simulation
 Methodology for construction of the hydrogeological model
 Methodology of the groundwater flow simulation
 Method of setting hydraulic boundary conditions
 Assessment of the uncertainty contained in obtained data, models and the results of groundwater flow simulation
2) Hydrogeological investigations
Hydrogeological investigations are divided into subsurface hydrological investigations and groundwater hydrogeological survey. The former studies infiltration mechanism of the surface water, whereas the latter studies the distribution of hydraulic conductivities and pore pressures in the deep rock mass, flow paths of groundwater and their continuity.
(1) Subsurface hydrological investigations
Water balance observation and groundwater observation are carried out in the Shobasama site to set the top boundary condition required for groundwater flow simulation. To evaluate the water balance around the Shobasama site, results of the water balance observation and groundwater observation carried out in the RHS Project can be used. Results of the subsurface hydrological investigations carried out in both the RHS Project and this project are as follows.
i) Water balance observation
Fig.4.37 is a location map of drainage basins for water balance observations carried out in the MIU Project and the RHS Project. Tab.4.14 is a list of water balance observatories. These drainage basins are set taking their topography, geology, relative location and scale into consideration56). Observation devices installed for the RHS Project in the drainage basin of the Shoba River can be used for this water balance observation.
Table 4.14 Details of water balace observation in the MIU Project
|
River
|
Drainage basin
|
Fluivo-meter
|
Lithology
|
Catchmentarea (ha)
|
Elevation (m)
|
Observation period
|
|
Toki River
|
Hiyoshi River
|
Shoba River
|
Shoba River
|
Shoba River
|
SPD
|
Toki Gravel, Sedimentary rocks
|
53.5
|
(224)
|
1989.4.21-
|
|
Upper stream
|
SPU
|
15.5
|
(253)
|
1989.4.21-
|
|
Itadoribora River
|
IPU
|
1.2
|
(267)
|
1993.3.6-
|
|
Shoba River model*
|
SPM
|
1.5
|
262
|
1998.12.24-
|
|
Garaishi River
|
Garaishi River
|
Garaishi River
|
GPD
|
Toki Gravel
|
23.3
|
296
|
1999.3.20-
|
|
Minor
|
GPU
|
Granite
|
1.0
|
342
|
1999.5.26-
|
|
Shizuhora River
|
Tono Mine
|
TPU
|
Toki Gravel,Sedimentary rocks
|
6.2
|
(257)
|
1990.9.18-2000.2.17
|
* : carried out in the MIU Project (The others carried out in the RHS Project)
Infiltration rates of the rock mass, which are converted to the yearly range from the observation results in the individual drainage basins for the past ten years are 0.31.0mm/day (0.6mm/day on average) in the Shoba River drainage basin, and 0.11.8mm/day (1.0mm/day on average) in the upper streams of Shoba River drainage basin. It indicates that there are spatial and temporal variations even in an drainage basin. The filtration rate in the Garaishi River basin, which is underlain by granite and located to the north of the Shobasama site, measures 0.2mm/day according to the observation in 1999 FY. It is necessary to establish a methodology for setting filtration rates of each domains by examining the correlation of infiltration rates of the rock mass with topography, geology and land utilization.
ii) Groundwater observation
The groundwater observation aims at understanding fluctuations of water level in unconsolidated layers (Seto Group) and sedimentary rocks (Mizunami Group) to make it basic data for directly simulating recharge rates. Locations of groundwater observatories for the MIU Project and the RHS Project are shown in Fig.4.38. Open-air-type water level gauges are used for measuring water level, while soil moisture meters are applied to soil and the upper part of the Seto Group.
Groundwater observations of the MIU Project are carried out in six boreholes shown in Tab.4.1557),58). In this study area, there are the TH-series-boreholes, SN-series-boreholes and the AN-6 around the Tono Mine, in which continuous observations on water level and water pressure are under way by open-air-type water gauges or multiple piezomerter systems (henceforth "MP system")59).
Soil moisture observations are carried out at two locations58) in the Shoba River model basin listed in Tab.4.16 with the purpose of understanding the water movement from unsaturated zone in the shallow layer above water gauges to saturated zone. By this observation, recharge rates can be directly measured. As for the outside of the study area, groundwater observations are under way at 12 stations in the Itadori-bora and Tono Mine drainage basins.
Table 4.15 Details of water level monitoring in the MIU Project
|
Borehole
|
Aimed geology
|
Location and sensitivity to rainfall
|
|
AI-4
|
Weathered part of granite Lowest part of Toki Lignite-bearing Fm. |
The vicinity of planned shaft in the Shobasama site
Hardly sensitive to rainfall |
|
97MS-01
|
Upper part of Akeyo Fm.
|
Ridge on the Shoba River model drainage basin
Sensitive only to heavy rain |
|
97MS-02
|
Lower part of Seto Group
|
Ridge on the Shoba River model drainage basin
Sensitive to rainfall |
|
98MS-03
|
Middle part of Akeyo Fm.
|
Ridge on the Shoba River model drainage basin
Not sensitive to rainfall |
|
98MS-04
|
Lower part of Seto Group
|
Slope in the Shoba River model drainage basin
Sensitive to rainfall |
|
99MS-05
|
Lower part of Akeyo Fm.
|
Slope in the Shobasama site, southward from planned shaft
Sensitive to rainfall, if not less sensitive than Seto Group |
Table 4.16 Details of soil moisture monitoring in the MIU Project
|
Tensiometer
|
Aimed geology
|
Location and sensitivity to rainfall
|
|
SmTP
|
Soil Upper part of Seto Group |
Located on ridge
Become saturated 7months after installation, but inconsistent with groundwater level ( > 3m).Since then, become sensitive even to light (4mm) rainfall ( < 2m)
No response except for heavy rain ( > 3m) |
|
SmTS
|
Soil Upper part of Seto Group |
Located in slope
Become saturated 3months after installation ( > 5m).
Sensitive to rainfall ( < 1.5m), whereas no response except for heavy rain ( > 2m) |
Infiltration rates of rainfall into the soil and the underlying weathered part of the Seto Group, which cover the surface of the hilly zone, have yet to be understood quantitatively due to immature measuring technique of soil moisture. On the other hand, groundwater reserved in the Seto Group, which occupies the upper half of hills surrounding the Shobasama site, is thought to form base flow of the Shoba River and others57), 60).
In the Mizunami Group develops an unsaturated zone, which produces confined groundwater separated from the groundwater in the overlying Seto Group. Furthermore, a heterogeneous distribution of geological formations in the Mizunami Group generates a heterogeneous distribution of water pressure in it57), 61), 62).
(2) Groundwater hydrogeological survey
The "Groundwater hydrogeological survey" refers to investigations to understand hydrogeological properties of the rock mass using boreholes exceeding several hundred meters in depth. While the drilling of the MIU-13 are in progress in the Shobasama site, hydraulic tests are carried out to decide such constants as hydraulic conductivity39), 40), 41). Methods and amounts of the hydraulic tests are shown in Tab.4.17. Crosshole hydraulic test between the MIU-2 and the MIU-3 is carried out to confirm whether the Tsukiyoshi Fault acts as a hydraulic barrier and to verify the continuity and physical properties of the "Fracture zone along the fault"65).
Table 4.17 Details of hydraulic tests
|
Borehole
|
Depth(m)
|
Details
|
Test amount
|
|
MIU Project
|
MIU-139) |
1,011.8
|
Pulse/slug tests are carried out for both fracture zone and intact rock, with 6.5m of test intervals. Also, pumping tests are carried out continuously with 100m of test intervals. |
Pulse/slug:28 Pumping:9
|
| MIU-240) |
1,012.0
|
Same as the MIU-1. In addition, flow rates in pumping test are carefully watched. Also, timing for pumping test completion is aimed to improve. |
Pulse/slug:30 Pumping:8
|
| MIU-341) |
1,014.0
|
Pulse/slug tests with several to several tens of meters intervals are carried out to aim at fracture (zone). Pumping tests with intervals up to 100m are carried out. The test intervals have been set according to fracture distribution and so on. Also, flow rates in pumping test are carefully watched. Reliability of analysis data is enhanced by adopting differential plot of change in water pressure. |
Pulse/slug:23 Pumping:11
|
|
Other geo-scientific researches
|
AN-1 |
1,010.2
|
Most excavation of AN-series boreholes are carried out from 1988 to 1989. Some are carried out in 1997. Test intervals are set 23m to aim mainly at fracture (zone). |
Pulse/slug:34
|
| AN-3 |
408
|
Pulse/slug:24
|
| DH-254) |
501
|
Pulse/slug tests are carried out for both fracture zone and intact rock, with 28m of test intervals. |
Pulse/slug:10
|
| DH-4 |
505
|
Pulse/slug:9
|
| DH-963) |
1,030.0
|
Pulse/slug tests are carried out with 6.5m of test intervals. Also, pumping test are carried out with 80m of test intervals. Test intervals include fracture (zone), intact part of granite and anormalies detected by physical logging. |
Pulse/slug:5 Pumping:1
|
| DH-1164) |
1,012.0
|
Pulse/slug tests are carried out with 10m of test intervals to aim at groundwater path. Pumping tests are carried out with 40116m of test intervals to cover all of hole. |
Pulse/slug:3 Pumping:8
|
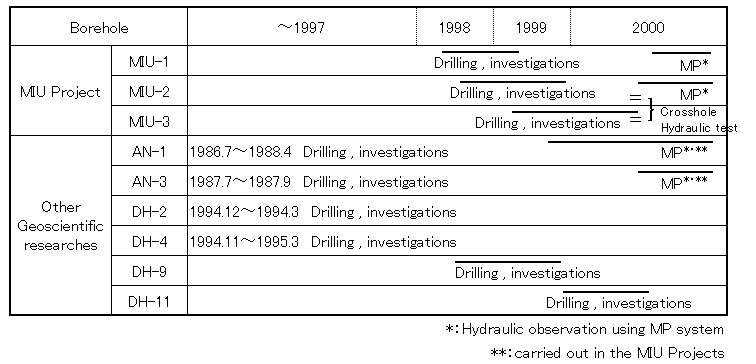
The MP systems are installed in boreholes for the continuous observation of water pressure and water chemistry after excavation. In the Shobasama site, drilling and investigations of the AN-series of boreholes are carried out prior to borehole investigations of the MIU-series of boreholes. In addition to using the information obtained by these investigations, the MP systems are installed in the AN-series of boreholes to obtain new data on the pressure and water chemistry. For hydraulic observations subsequent to the shaft excavation, not only MP systems but also continuous monitoring devices of groundwater, soil moisture and river flow are installed. Tab.4.18 shows timetable of drilling and investigations in the boreholes in the Shobasama site (MIU-13, AN-1 and AN-3) and the DH-series of boreholes drilled for the RHS Project.
Table 4.18 Timetable of drilling and investigations
Results of the pumping tests carried out in the MIU-13 are shown in Fig.4.39 as a vertical distribution of hydraulic conductivity by the depth. The basal conglomerate of the Toki Lignitel-bearing Formation, the weathered part of the granite, "Upper fracture zone", "Moderately fracture zone", "Fracture zone along the fault" and the Tsukiyoshi Fault are extracted as geological structures controlling the groundwater hydrology. Results of permeability tests (pulse/slug tests) and pumping tests indicate that the permeability of the "Moderately fracture zone" is about an order lower than that of the "Upper fracture zone" and "Fracture zone along the fault" (Fig.4.40).
An example of the pore water pressure distribution in the Shobasama site is shown in Fig. 4.41. The pore water pressures are measured in the individual measuring sections in the MIU-13, As a result, the largest pressure difference is recognized between the measuring sections on the both sides of the Tsukiyoshi Fault. The fault crosses the MIU-2 at an elevation of -650m in the correlation graph between elevation and pore pressure and at No.26 measuring section in the water level histogram, respectively. No.13 measuring sections, which are characterized by a high pore pressure decreasing to the deeper part, correspond with the distribution interval of the Akeyo Formation (consisting of mudstone, sandstone and conglomerate). It suggests that the mudstone and sandstone in the formation are low in permeability to form a hydraulic barrier. The fact that the Akeyo Formation in the Shobasama site has a higher pore pressure is ascertained in the 99MS-05 for the surface water hydrological survey.
In general, the pore pressure in the MIU-2 is higher and more variable along the depth than that in the MIU-1. As for the pore pressure in the MIU-3, it has a atendency similar to that in the MIU-2 though it is affected by the pressure release of the MIU-2. The verification of temporal change in pore pressure and the observation on annual/seasonal variations in pore pressure behavior as well as hydrogeological effects of borehole excavations are in progress.
3) Hydrogeological model and groundwater flow simulation (study area: ca.4kmca.6 km)
(1) Overview
Based on the result of hydrogeological investigations and the problems to be solved in the 2nd analysis loop, a groundwater flow simulation is carried out66) using the undermentioned model. It aims to verify a hydrogeological model and methodology for groundwater flow simulation. This model expresses the heterogeneous distribution of physical properties (originated in such discontinuous structures as fractures) of the rock mass by an equivalent continuum. This model is called henceforth "equivalent continuum model".
(2) Setting of the study area
The study area is almost identical with that in the 1st analysis loop (ca.4kmca.6km with the Shobasama site at its center).
(3) "equivalent continuum model"
This model allows expressing discontinuous and heterogeneous hydrogeological properties in the rock mass by dividing the study area into finite elements and by computing permeability tensors of the individual finite elements from the information on fracture distribution. Unlike the discontinuum model dealing with each fracture, this model sets an equivalent physical value (permeability, etc.) in response to fracture density in each mesh. Therefore, this model is suitable for groundwater flow simulation on several-kmseveral-km fractured rock mass.
(4) Hydrogeological model
i) Procedure of model construction
The procedure of model construction to groundwater flow simulation is shown in Fig.4.42. On the basis of geological units (See Chapter 4.1) and the results of hydrogeological investigations (See Chapter 4.2.3 2)), "equivalent continuum model" is constructed for ca.4kmca.6km area.
A statistical processing of fractures is applied only to the "Upper fracture zone", "Moderately fracture zone" and "Fractured zone along the fault". Like in the 1st analysis loop, a definite physical value is given to each of the geological formations of sedimentary rocks, the weathered part of granite and the Tsukiyoshi Fault as a homogeneous continuum. For the sedimentary rocks and the Tsukiyoshi Fault, fracture network systems are not given. The weathered part of the granite is not only so poor in information but also porous due to weathering and alteration that it is dealt as a uniform zone with a definite physical property. As a result, it is exempted from statistical processing of fractures.
ii) Generation of fracture network model
The construction of "equivalent continuum model" requires determining the statistical distribution of geometrical azimuths, opening widths and radii of fractures. The 3-D fracture density is also required. Particularly, hydraulic opening widths must to be used instead of geometrical ones observed on the walls of rock mass or boreholes.
Fig.4.43 shows the process of generation of fracture network model. The main process is as follows.
extract open fractures which are generally presumed highly permeable, based on results of BTV investigations
determine their orientations (n), intensities (1-D fracture density) in boreholes ( 1) and geometrical apertures (tg)
carry out virtual permeability tests simulating hydraulic tests in boreholes.
estimate the averages of radii (r) and hydraulic apertures (th) of fractures by comparing simulated and measured values of hydraulic conductivities
calculate 3-D densities (3) by inputting a mean square value of fracture diameter and 1 into a geometrical relational expression of fracture density.
(i) Statistical values of fractures
a) Orientation (n)
According to cluster analysis, fractures in the "Upper fracture zone" are divided into four sets with the following major attitudes: (1) a low angle, (2) N (50 70)E,(7080)SE, (3) N (8090)W,(6070)N and (4) N (2050)E,(7080)SW. Based on the results of cluster analysis, fractures are divided into some groups on Schmidt's net, and fracture orientations are defined by the Bingham distribution. Parameters of fracture (Fig.4.44) are shown in Tab.4.19.
Table 4.19 Fracture density according to the results of the BTV investigations
|
|
Interval
|
Frequency
|
Fracture density (n/m)
|
Open fracture density (n/m)
|
|
"Upper fracture zone"
|
Set-1
|
1911
|
2.479
|
0.045
|
|
Set-2
|
341
|
0.442
|
0.008
|
|
Set-3
|
484
|
0.628
|
0.011
|
|
Set-4
|
732
|
0.949
|
0.017
|
|
Total
|
3468
|
4.498
|
0.082
|
|
"Moderately fracture zone"
|
Set-1
|
839
|
0.755
|
0.014
|
|
Set-2
|
461
|
0.451
|
0.008
|
|
Set-3
|
538
|
0.484
|
0.009
|
|
Set-4
|
583
|
0.524
|
0.010
|
|
Total
|
2421
|
2.177
|
0.039
|
|
"Fracture zone along the fault"
|
Set-1
|
1670
|
1.888
|
0.034
|
|
Set-2
|
809
|
0.915
|
0.017
|
|
Set-3
|
1128
|
1.275
|
0.023
|
|
Set-4
|
873
|
0.987
|
0.018
|
|
Total
|
4480
|
5.066
|
0.092
|
The Fisher distribution (hemispheric normal distribution) has been most popular as a statistical model to express orisntations of fractures in the rock mass. The Fisher distribution is characterized by an isotropic distribution around the center of dominant orisntation. On the other hand, the Bingham distribution is characterized by an anisotropic distribution and allows modeling an elliptic or belt-shaped distribution. Orisntations of fractures in the MIU-13 are not always isotropic, suggesting constraints on the reproduction of data by the Fisher distribution. Thus, the Bingham distribution is employed for modeling orientations of fractures.
b) Intensities (1-D fracture density) (1)
Fractures confirmed by BTV investigations amount 10,369. Open fractures is 188 out of 10,369, accounting for about 1.8% of the total. 1-D densities of all fractures and open fractures are shown for the four major orientation sets in the individual zones in Tab.4.19.
c) Geometrical aperture (tg)
On the basis of the data on opening widths of open fractures obtained by the BTV investigations, the relationships between apertures and 1-D fracture densities (the total number of open fractures with openings less than a given value) are examined. The result is shown in Tab.4.20.
Table 4.20 Relationship between aperture and fracture density of the MIU-13
|
Aperture(mm)
|
Frequency
|
Accumulative percentage (%)
|
Accumulative frequency
|
Fracture density (n/m)
|
|
0.0
|
60
|
100.00
|
188
|
0.0688
|
|
0.5
|
15
|
68.09
|
128
|
0.0468
|
|
1.0
|
42
|
60.11
|
113
|
0.0413
|
|
1.5
|
21
|
37.77
|
71
|
0.0260
|
|
2.0
|
10
|
26.60
|
50
|
0.0183
|
|
2.5
|
15
|
21.28
|
40
|
0.0146
|
|
3.0
|
4
|
13.30
|
25
|
0.0091
|
|
3.5
|
4
|
11.17
|
21
|
0.0077
|
|
4.0
|
4
|
9.04
|
17
|
0.0062
|
|
4.5
|
4
|
6.91
|
13
|
0.0048
|
|
5.0
|
2
|
4.79
|
9
|
0.0033
|
|
5.5
|
1
|
3.72
|
7
|
0.0026
|
|
6.0
|
2
|
3.19
|
6
|
0.0022
|
|
6.5
|
1
|
2.13
|
4
|
0.0015
|
|
7.0
|
1
|
1.60
|
3
|
0.0011
|
|
7.5
|
0
|
1.06
|
2
|
0.0077
|
|
8.0
|
0
|
1.06
|
2
|
0.0077
|
|
8.5
|
0
|
1.06
|
2
|
0.0077
|
|
9.0
|
0
|
1.06
|
2
|
0.0077
|
|
9.5
|
0
|
1.06
|
2
|
0.0077
|
|
10.0
|
0
|
1.06
|
2
|
0.0077
|
|
>10.0
|
2
|
1.06
|
2
|
0.0077
|
(ii) Generation of fracture network model by the virtual permeability tests
a) Virtual permeability tests
Virtual permeability test is a trial-and-error method to determine fracture statistics (fracture radius, hydraulic aperture and 3-D fracture densities) through numerical simulations of hydraulic tests. From the fracture statistics, distribution of hydraulic conduntivity is expected to be obtained as if actual permeability tests are carried out. The fracture radii, hydraulic apertures and 3-D densities used in the computing process are shown in Fig.4.45.
b) Distribution of hydraulic conductivity
Results of single-borehole permeability tests carried out in the MIU-13 are used for comparison with results of the virtual permeability tests. Fig.4.40 shows distributions of hydraulic conductivities obtained by permeability tests carried out in the granite. The results indicate that measured hydraulic conductivities roughly show a log-normal distribution. These hydraulic conductivities extend over a numerical range exceeding 8digits, indicating an extremely high heterogeneity. Also, it indicates that the hydraulic conductivity of the "Moderately fracture zone" is nearly an order lower than those of the "Upper fracture zone" and "Fracture zone along the fault". The virtual permeability tests (described below) compute the fracture distribution parameters that allow reproducing these tendencies.
c) Virtual permeability tests
Given 1-D fracture densities and fracture radii distribution (or diameter distribution), 3-D fracture densities are gained by the following equation:
3=4/ 1/<d2> , (4.2.1)
1: 1-D fracture density, 3: 3-D fracture density, <d2>: a mean square of fracture diameter
In the identification of parameters by virtual permeability tests, it is confirmed whether or not the tests can express the groundwater hydrology on the following assumptions.
Only open fractures are employed to determine the 1-D fracture distribution.
Open fractures are generally thought to control groundwater hydrology.
Aperture of fractures shows a negative exponential distribution. One distribution parameter is applied to all of the fracture groups.
Open fracture are too few to examine distribution patterns of the individual fracture groups. Therefore, not only to all open fractures but to the individual groups of fractures, a negative exponential distribution is applied.
The Bingham distribution is applied to the orientation distribution of the individual fracture groups.
The Bingham distribution is employed to express an anisotropic tendency of the fracture distributions.
The following truncated power law distribution and negative exponential distribution are assumed to express the distribution of fracture radii. Irrespective of fracture groups, one distribution parameter is applied to a group.
Power distribution and negative exponential distribution are applied on the basis of the existing studies67), 68).
f(r)=(b-1)/rmin[(rmin-1)/r]b , r rmin (b=3)
f(r)= exp(-r) , but =1/<r>
r : fracture radius, rmin : minimum fracture radius, b : power number, <r> : avarage of fracture radii
In the modeling of fracture radii by a truncated power law distribution and a negative exponential distribution, the mean square of fracture diameters are obtained by the following equations.
Truncated power law distribution
<d2>=(b-1)(2rmin)2{ln(2rmax)-ln(2rmin)} ,
Negative exponential distribution
<d2>=(1/){exp(-dmin)(2dmin2+2dmin+2)-exp(-dmax)(2dmax2+2dmax+2)}
rmax : maximum fracture radius, dmin : minimum fracture diameter, dmax : maximum fracture diameter
The <d2> heavily depends on rmin in truncated power law distribution and É in negative exponential distribution, respectively.
There is a linear proportional correlation between geometrical and hydraulic apertures.
No tracer test is carried out, therefore, hydraulic aperture cannot be verified. It is thought to be the most conservative at the moment to assume that geometrical apertures continue without change by neglecting irregularities of fractures.
Truncated power law model
The prediction of 3-D open fracture density (3) based on 1-D open fracture density (1) by Equation (4.2.1) failed to completely reproduce measured distributions of hydraulic conductivities with a range up to 8digits as is shown in Fig.4.46. It is difficult to make the whole measured data with such a wide distribution range match with the truncated power law model. Therefore, it is required in the future to devise a method (e.g. to make measured data of the individual geological units match with the model). The present simulation adopts the truncated power law model employing rmin = 70m and rmax = 3,000m, which shows the best matching between measured and computed data. In this case, 1-D density of open fractures is taken into consideration, and the linear (log-normal) distribution of measured data is retained.
Negative exponential model
The main aim of simulation is to reproduce the heterogeneity of measured hydraulic conductivities. The simulation following the procedure shown in Fig.4.43, which uses open fractures detected by BTV investigations, fails to achieve the matching between measured and computed values. Accordingly, it is attempted to find fracture distribution parameters that allow computed values to approach the measured values by changing 1-D fracture densities. This simulation indicates that the distribution of hydraulic conductivity is hardly affected by the value of rave under a constant value of <d2> in the negative exponential model. Thus, the effect of reduction in 1-D fracture density (1) is examined at a fixed value of rave=80m. As a result, it turns out that the effect of a change in1 on the heterogeneity of hydraulic conductivity distribution is larger than that of the average fracture radius (rave) in the truncated power law model. However, too small value of 1 results in frequent appearance of permeability ranging from 10-11 to 10-10m/sec. In this case, distribution of hydraulic conductivity greatly deviates from a log-normal distribution (Fig.4.47). Thus, the comparison with the distribution of measured hydraulic conductivity justifies to adopt rave=80m and1=0.0049 for the negative exponential model.
Above-mentioned two distribution models are summarized in Tab.4.21. Comparing the two models, average fracture diameters and 3-D fracture densities are almost similar. However, the former has a larger distribution range of fracture radii and a higher 1-D fracture density. Thus, the latter is characterized by lower fracture continuity and higher heterogeneity of hydraulic conductivity.
Table 4.21 Details of fracture models
|
|
rmin
|
rmax
|
rave
|
<d>
|
<d2>
|
1
|
2
|
|
Model 1
|
Truncated power law
|
70m
|
3,000m
|
-
|
137m
|
1.47 10 5 m 2 |
6.79 10 -2 |
5.87 10 -7 |
|
Model 2
|
Negative exponential
|
-
|
-
|
80m
|
160m
|
1.28 104 m 2 |
4.9 10 -3 |
4.91 10 -7 |
(iii) Summary
Fracture distribution parameters determined by the above-mentioned simulations are listed up in Tabs.4.22 and 4.23. Fracture densities (1, 3) in the individual zones are calculated using whole fracture densities simulated for the above-mentioned models and the fracture ratio in the sets shown in Tab.4.19. On the assumption that hydraulic aperture is proportional to geometrical aperture, a proportional constant is set so that logarithmic means of both in-situ permeability tests and virtual permeability tests become equal.
Figs.4.46 and 4.47 show comparison between simulated distributions of hydraulic conductivity and the measured values in the each model.
In the truncated power law model, simulated distributions in a low to intermediate hydraulic conductivity range (cumulative probabilities : 050%) well reproduce the measured data. However, the highly permeable part (hydraulic conductivity > 10-7cm/sec.) is insufficiently reproduced by the simulation. That is, the truncated power law model underestimates the frequency of a high permeability part in the rock mass of the Shobasama site. The comparison indicates that the truncated power law model and the negative exponential model reproduce a poorly permeable part and a highly permeable part, respectively.
Table 4.22 Parameter of statistical fracture distribution
(Truncated power law model)
|
Set
|
Fracture density
1(n/m) |
Mean geometrical aperture
tg(m)
|
Mean hydraulic aperture
th(m)
|
Mean fracture radius
rave(m)
|
Volumetric fracture density
3(1/m 3) |
|
"Upper fracture zone"
|
Set-1
|
4.49 10 -2 |
1.70 10 -3 |
7.91 10 -5 |
70
|
3.88 10 -7 |
|
Set-2
|
8.02 10 -3 |
6.39 10 -8 |
|
Set-3
|
1.14 10 -2 |
9.84 10 -8 |
|
Set-4
|
1.72 10 -2 |
1.49 10 -7 |
|
"Moderately fracture zone"
|
Set-1
|
1.37 10 -2 |
1.70 10 -3 |
7.91 10 -5 |
70
|
1.18 10 -7 |
|
Set-2
|
7.52 10 -3 |
6.50 10 -8 |
|
Set-3
|
8.77 10 -3 |
7.58 10 -8 |
|
Set-4
|
9.51 10 -3 |
8.22 10 -8 |
|
"Fracture zone along the fault"
|
Set-1
|
3.42 10 -2 |
1.70 10 -3 |
7.91 10 -5 |
70
|
2.96 10 -7 |
|
Set-2
|
1.66 10 -2 |
1.43 10 -7 |
|
Set-3
|
2.31 10 -2 |
2.00 10 -7 |
|
Set-4
|
1.79 10 -2 |
1.55 10 -7 |
|
PDFs
|
Bingham
|
Negative exponential
|
Negative exponential
|
Negative exponential
|
Truncated power law
|
Table 4.23 Parameter of statistical fracture distribution
(Negative exponential model)
|
Set
|
Fracture density
1(n/m) |
Mean geometrical aperture
tg(m)
|
Mean hydraulic aperture
th(m)
|
Mean fracture radius
rave(m)
|
Volumetric fracture density
3(1/m 3) |
|
"Upper fracture zone"
|
Set-1
|
3.26 10 -3 |
1.70 10 -3 |
1.70 10 -4 |
80
|
3.25 10 -7 |
|
Set-2
|
5.82 10 -4 |
5.79 10 -8 |
|
Set-3
|
8.26 10 -4 |
8.22 10 -8 |
|
Set-4
|
1.25 10 -3 |
1.24 10 -7 |
|
"Moderately fracture zone"
|
Set-1
|
9.93 10 -4 |
1.70 10 -3 |
1.70 10 -4 |
80
|
9.88 10 -8 |
|
Set-2
|
5.46 10 -4 |
5.43 10 -8 |
|
Set-3
|
6.37 10 -4 |
6.33 10 -8 |
|
Set-4
|
6.90 10 -4 |
6.86 10 -8 |
|
"Fracture zone along the fault"
|
Set-1
|
2.49 10 -3 |
1.70 10 -3 |
1.70 10 -4 |
80
|
2.47 10 -7 |
|
Set-2
|
1.20 10 -3 |
1.20 10 -7 |
|
Set-3
|
1.68 10 -3 |
1.67 10 -7 |
|
Set-4
|
1.30 10 -3 |
1.29 10 -7 |
|
PDFs
|
Bingham
|
Negative exponential
|
Negative exponential
|
Negative exponential
|
Truncated power law
|
For the both models, simulated hydraulic conductivities decrease from "Fracture zone along the fault" to "Upper fracture zone", and further to "Moderately fracture zone". This tendency is same as that of the measured values. Based on the fracture distribution parameters shown in Tabs.4.22 and 4.23, hydrogeological model is constructed using an equivalent continuum taking the hydrogeological heterogeneity of the Shobasama site into consideration.
iii) Construction of hydrogeological model
(i) Formation of 3-D meshes
3-D finite element meshes are formed for groundwater flow simulation, based on the geological units expressed in the geological model and the 3-D distribution of permeable fractures described in the previous section. The followings are taken into consideration.
The topography is expressed by plane meshes.
Geological formations and faults expressed in the geological model are expressed by 3-D meshes.
The shaft and galleries in the Tono Mine are expressed by nodal points or elements.
Locations of major boreholes are arranged to coincide with lattice points of the plane mesh.
Large-scale fracture zones are expressed by 3-D meshes, if necessary.
3-D meshes are formed, taking boundaries of the geological units shown in Tab.4.24 into consideration. The 3-D meshes are shown in Fig.4.48. The number of the elements and nodal points total up to 99,293 and 61,395, respectively.
Table 4.24 Geological units and hydraulic conductivities
set for the homogeneous model
|
Geological units
|
Hydraulic conductivity (m/sec)
|
| Seto Group |
1.0 10 -7 |
| Oidawara Fm. |
1.0 10 -9 |
| Akeyo Fm. |
1.0 10 -8 |
| Toki Lignite-bearing Fm. (Upper) |
5.0 10 -9 |
| Toki Lignite-bearing Fm. (Basal conglomerate) |
1.0 10 -7 |
| Toki Granite (Weathered) |
1.0 10 -7 |
| "Moderately fracture zone" |
1.0 10 -9 |
| "Upper fracture zone" |
2.0 10 -8 |
| Tsukiyoshi Fault |
1.0 10 -10 |
| "Fracture zone along the fault" |
1.0 10 -7 |
Using these meshes, the 3-D distribution of permeable fractures described in the previous section is statistically developed in the granite to construct "equivalent continuum model". For each of the two fracture distribution models (truncated power law model and negative exponential model), a case of fracture distribution is developed. Fig.4.49 shows the comparison between the above-mentioned two models. Each block in the figure is a cube with sides 60m-long. It turns out that the truncated power law model develops more continuous fractures than the negative exponential model.
Fig.4.50 shows homogeneous model, truncated power law model and negative exponential model. These three models are used for simulation. Here, "homogeneous model" refers to a model where a definite hydrogeological property is given to each of the geological formations without taking no heterogeneous permeability generated by fracture distribution into consideration.
In the homogeneous model (Fig.4.50(a)), hydraulic conductivity listed in Tab.4.24 is applied to the finite element meshes shown in Fig.4.28. Most of the hydraulic conductivities applied to each geological unit are identical with those set for the 1st analysis loop (Tab.4.13). However, hydraulic conductivities of the Akeyo Formation and the lower part of the Toki Lignite-bearing Formation are changed so that they represent each element more precisely, with paying attention to contrasts among the geological units. Specifically, the Akeyo Formation is given the permeability of 1.0~10-8m/sec. to represent its typical lithofacies of fine- to medium-grained sandstone. The Lower Toki Lignite-bearing Formation is given the permeability of 1.0~10-7m/sec because its highly permeable basal conglomerate and the weathered part of the granite have similar hydrulic conductivities of 1.0~10-7m/sec. The "Upper fracture zone", "Moderately fracture zone" and "Fracture zone along the fault" have so little data that their hydraulic conductivities are set on the basis of all of the results of hydraulic tests carried out in the MIU-13.
Hydraulic boundary conditions for simulation are set as follows:
Top boundary condition (Ground surface)
Taking rainfall into consideration, the recharge rate at the ground surface is set as the top boundary condition. The recharge rate of 0.28mm/day (the mean calculated from observations carried out from 1990 to 1997 in the vicinity of the Tono Mine) employed by the RHS Project is applied to a groundwater simulation (steady), and its results are compared with the data of groundwater observation. The results show the head distribution obtained by the simulation shows higher values than the observation data. While it might be presumably caused by the setting of the recharge rate and/or the side boundary, the real cause has yet to be specified at the moment. Thus, on the assumption that the setting of the recharge rate exerts a great influence on the results of simulation, the recharge rate is amended to 0.14mm/day so that the simulated results coincide with the observed data. Taking spring water into consideration, the ground surface is postulated as a free seepage surface with inflow and outflow of water. The setting of recharge rate will be examined in detail in future.
Bottom boundary condition
The bottom boundary is set as an no-flow boundary devoid of inflow and outflow of water.
Side boundary condition
The side boundaries forming mountain ridges (northern, eastern and western boundaries) are given definite hydrostatic pressures in response to the depth as a permeable boundary. The constant head values given to the side boundaries are calculated by the following formula between the water level data in boreholes and elevations of the ground surface:
 (constant head value) = 0.86H (elevation of each location) + 18.5.
The side boundary along the Toki River (southern boundary) is also given definite hydrostatic pressure in response to the depth as a permeable boundary. An elevation of the river surface is employed as the constant head values given to the southern boundary.
Galleries of the Tono Mine and MIU's shaft
Since the Tono Mine's galleries modelled using nodal points are exposed to atmospheric pressure, the constant head value is set as the pressure head of 0m. As for the MIU's shaft modeled using elements, corresponding elements are deleted from the hydrogeological model with the advance of planned shaft excavation. Nodal points corresponding with the shaft wall after excavation are regarded as free seepage points.
(5) Groundwater flow simulation
The groundwater flow simulation adopts the saturated/unsaturated seepage flow analysis code (EQUIV-FLO) aimed at an equivalent heterogeneous continuum (heterogeneous porous media). This code has governing equations including Darcy's law taking unsaturated domains into consideration and water phase continuous equation (mass conservation law)69). The 3-D steady/non-steady groundwater flow simulation is carried out from a viewpoint of the current hydrology with existing drifts of the Tono Mine and the predictive hydrology affected by the excavation of the MIU's shaft.
i) Simulation cases
Simulation cases are set as follows.
Case 1 : steady-state homogeneous model
Case 2 : steady-state truncated power law model
Case 3 : steady-state negative exponential model
Case 4 : non-steady-state homogeneous model
Case 5 : non-steady-state truncated power law model
Case 6 : non-steady-state negative exponential model
The excavation schedule of the shaft, which is used for the above-mentioned non-steady-state simulations, is set shown in This schedule is set Tab.4.25 by not only referring to the work schedule70) examined in 1998 FY but taking the mesh structure of hydrogeological model into consideration.
Table 4.25 Assumed schedule of shaft excavation
|
Stage
|
Depth (m)
|
Elevation (m)
|
Accumulative time (days)
|
|
2
|
21.8
|
209.635
|
39.1
|
|
3
|
41.0
|
190.435
|
73.5
|
|
4
|
60.2
|
171.235
|
108.0
|
|
5
|
79.4
|
152.035
|
142.4
|
|
6
|
101.8
|
129.635
|
182.6
|
|
7
|
145.3
|
86.135
|
260.8
|
|
8
|
205.9
|
25.535
|
369.4
|
|
9
|
266.4
|
-34.965
|
478.1
|
|
10
|
306.8
|
-75.365
|
550.1
|
|
11
|
327.0
|
-95.565
|
586.7
|
|
12
|
508.5
|
-277.065
|
912.5
|
|
13
|
508.5
|
-277.065
|
1,460.0
|
|
14
|
690.0
|
-458.565
|
1,638.0
|
|
15
|
871.5
|
-640.065
|
2,099.0
|
|
16
|
1,004.4
|
-769.965
|
2,250.0
|
ii) Results of the steady-state simulations
Steady-state simulations are carried out with the purpose of understanding the current groundwater hydrology in the study area and establishing initial conditions to predict effects of the shaft excavation. The results of simulations using three models are shown in Figs.4.51, 4.52, 4.53 and 4.54 show water pressure distribution (a bird's-eye view), pressure distribution in horizontal sections, the pressure distribution in different vertical sections and the comparison between simulated and measured data of head and water pressure, respectively. The major results are as follows.
Head distributions in all the models indicate that the groundwater flows from the northern side (mountain area) to the southern side (the Toki River) of the study area.
In shallow parts are recognized local topographical effects exemplified by a groundwater flow along the Hiyoshi River running from north to south on the east side of the study area (Figs.4.52 and 4.53). Topographical effects on the pressure distribution weaken toward the depth, resulting in a dominant flow from north to south.
The groundwater flow simulation using the hydrogeological model in the 1st analysis loop fails to reproduce a barrier effect of the Tsukiyoshi Fault. However, the hydrogeological model (homogeneous model) in 2nd analysis loop allows reproducing the barrier effect.
All of the models used in the 2nd analysis loop more or less show a barrier effect of the Tsukiyoshi Fault on the southward groundwater flow. Especially, the barrier effect of the fault in the sedimentary rocks and the "Upper fracture zone" of the granite are clearly shown (Fig.4.52). In the "Moderately fracture zone" are recognized remarkable barrier effects of the fault in the truncated power law model and negative exponential model, whereas it is less distinct in the homogeneous model. It is presumed to be due to a small difference in hydraulic conductivity in the model between the fault (10-10m/sec.) and the "Moderately fracture zone" (10-9m/sec.). On the other hand, the logarithmic mean of hydraulic conductivities of the "Moderately fracture zone" is set at 10-9m/sec. in both of the truncated power law model and negative exponential model. However, the hydraulic conductivity varies so widely that it attains to some 10-6m/sec. in parts where fractures are concentrated or fractures with large opening widths occur. Thus, the barrier effect of the fault probably appears more distinctly in the truncated power law model and negative exponential model than in the homogeneous model.
Flow rate in the granite varies narrowly in the homogeneous model, whereas highly permeable fractures generate locally fast groundwater flow in the truncated power law model and negative exponential model (Fig.4.53).
Heads (measured) in the MIU-13 are basically equals to hydrostatic pressures. On the other hand, heads in the MIU-2 and MIU-3, which cross the Tsukiyoshi Fault in the granite, discontinuously change on the both sides of the fault (Fig.4.54). Especially in the MIU-2, the head on the footwall side of the fault is some 30m higher than that on the hanging wall side, when converted to water level. While simulated values are generally higher than the measured ones generally, they are more conformable in the negative exponential model than in the other models. Also, pressure rise on the footwall side of the fault in the MIU-3 is not measured. This is presumed to be due to a drop in water pressure caused by the penetration of the fault by the MIU-2. Head values obtained by the homogeneous model take a middle position between those obtained by the truncated power law model and negative exponential model (Fig.4.54).
 The water pressure distribution in the AN-1 and AN-3 in the southern part of the Shobasama site show nearly a hydrostatic pressure distribution. In the AN-1 are found sections with a local high of measured head and a local low of measured head at the depth. However, the simulated results fail to reproduce the local variations of measured values. Furthermore, simulated heads are generally higher than the measured ones.
iii) Results of the non-steady-state simulations
Results of the simulations in the following two stages out of 16stages shown in Tab.4.25 are exemplified below.
Stage-13 : Left untouched for about one and half a year after excavation to 508.5m in depth
Stage-16 : shaft excavation is completed to 1,001.4m in depth after penetrating the Tsukiyoshi Fault
(i) Effects of the shaft excavation on water pressure distribution in Stage-13
Stage-13 represents a point of time when the shaft is excavated about half the total depth. Vertical profiles of the water pressure distribution shown in Fig.4.55 indicate that the shaft excavation causes a drop in the adjacent water pressure in any models. Furthermore, a lowering of water level around the shaft is wider than the stage prior to the excavation (Fig.4.53).
A cone-shaped drop in water pressure develops around the shaft in the homogeneous model (Fig.4.55(a)). On the other hand, partially irregular-shaped drops form in the truncated power law model and negative exponential model (Figs.4.55(b) and (c)). They are created by the excavation effects propagated along permeable fractures crossing the shaft. Especially, in the truncated power law model containing fractures with a large diameter (Fig.4.55(b)), extensive pressure drop is formed by shaft-crossing fractures in the "Upper fracture zone". The pressure drop also develops along fractures in the negative exponential law model (Fig.4.55(c)). However, the frequency of large fractures in this model is lower than in the truncated power law model, resulting in a smaller extent of pressure drop.
Effects of the shaft excavation are blocked by the Tsukiyoshi Fault in any models, hardly extending to the north side of the fault (Figs.4.55 and 4.56). On the other hand, the pressure drop zone extends east and west, forming a striking contrast to the pressure distributions along the north-south profiles that are featured by an abrupt change generated by the fault (Figs.4.55 and 4.56). The distribution of flow velocity vectors of groundwater in the north-south profiles indicates that water is supplied into the shaft from the ground surface and the depth through fractured zones around the fault. In the truncated power law model and negative exponential model occasionally develop concentrated flows through fractures from the fractured zones around the fault toward the shaft.
Pressure distributions in the horizontal sections at elevations of +150 m and  0 m above the shaft bottom (GL-508.5m; at an elevation of -277.0m) show a pressure drop around the shaft (Fig.4.56). The pressure drop area at an elevation of +150 m forms a concentric circle around the shaft in the homogeneous model (Figs.4.55 and 4.56). However, the extent is too limited to exert an influence on the initial pressure distribution of the Tono Mine. The pressure drop in the truncated power law model affects the largest area among the three models, extending to the Tono Mine and the Shobasama site. It is probably because the pressure drop zones along fractures in the granite affect on the groundwater flow in the shallow part. The pressure drop area in the negative exponential model is not as large as in the truncated power law model. However, it extends to the pressure drop area of the Tono Mine. Excavation effects of the shaft are found at an elevation of 0m, too. The pressure drop area around the shaft in the homogeneous model is also linked with the pressure drop area around the Tono Mine. The effect, however, scarcely extends onto the north side of the fault. The affected area in the truncated power law model is the largest among the three models, partially extending to the north side of the fault, too. It is probably because parts of the fractures extend northward across the fault during their formation. Though fractures across the fault have yet to be ascertained, this gives a suggestion on the extent of excavation effects of the shaft when such fractures are actually verified. No effect of the pressure drop at an elevation of 0m extends to the north across the fault in the negative exponential model. It is probably because fractures with a large diameter in negative exponential model are less than in the truncated power law model. Effects of the shaft excavation gradually lessen beneath the borehole bottom, scarcely found at an elevation of -600m except in the truncated power law model. In the truncated power law model, however, a small pressure drop area occurs even at an elevation of -700m, extending northward across the fault. This indicates that large fractures in the "Upper fracture zone" in the granite exert an extensive influence of pressure drop horizontally as well as vertically.
(ii) Effects of the shaft excavation on water pressure distribution in Stage-16
Stage-16 represents a point of time when the shaft excavation completes after penetrating the Tsukiyoshi Fault. In this stage changes in water pressure extend into the north side of the fault in all of the models (Figs.4.57 and 4.58). In the homogeneous model, above all, a conical pressure drop domain extends on the both north and south sides of the fault to show a bilateral symmetry (N-S, E-W). This is thought to be caused by the fault being penetrated by the shaft (Fig.4.58).
The water level distribution shallower than an elevation of -300m shows no big change after the Stage-13 on both the north and south sides of the fault (Figs.4.55 and 4.57). It indicates that the shaft excavation almost stops affecting the water level in the shallow part above an elevation of -300m as soon as the shaft passes through the sedimentary rocks and the "Upper fracture zone" of the granite. The water flows along the "Fracture zone along the fault" are more remarkable than in the Stage-13, directly pouring into the shaft.
The horizontal sections of pressure distribution show pressure drops on the north side of the fault, which were caused by the penetration of the fault by the shaft, in the truncated power law model and negative exponential model. However, they are not as extensive as in the homogeneous model (Fig.4.58). This indicates that the barrier effect of the fault in the rock mass with homogeneous permeability differ from that in the rock mass with heterogeneous one. That is, it is presumable that effects of a pressure drop by the shaft excavation selectively propagate through highly permeable fractures in the heterogeneous model, whereas they almost concentrically spread in the homogeneous model. The size of pressure drop area around the shaft at an elevation of -600m decreases in order of the homogeneous model, the truncated power law model and the negative exponential model. The order is the same as that of the fracture continuity. In other words, the homogeneous model is thought to be the highest in continuity.
There is little change in pressure distribution at an elevation of 0m in the shallow part from the Stage-13 to the Stage-16. Pressure drop areas develop around the shaft below an elevation of -400m. The difference in pressure distribution among the three models is not as large as in the shallow part. It is probably because this section is in the "Moderately fracture zone" that has few fractures and especially fractures with large diameters.
vi) Summary
Results of the construction of the hydrogeological model and groundwater flow simulation are summarized as follows.
In the 2nd analysis loop, the homogeneous, truncated power law model and negative exponential model are constructed. They are constructed on the basis of the data on fracture distribution and hydraulic conductivity obtained in the 1,000m-class MIU-13 excavated inside the Shobasama site. The truncated power law model is more dispersed in fracture diameter than the negative exponential model, that is, contains fractures with larger diameter. The negative exponential model is aimed at reproducing better the heterogeneity in measured hydraulic conductivity and characterized by a lower 1-D fracture density.
No remarkable difference is found in groundwater flow prior to the shaft excavation between the homogeneous model (not takes fractures into consideration) and truncated power law model and negative exponential model (takes fractures into consideration).
The shaft excavation generates a conical pressure drop domain around the shaft in the homogeneous model. On the other hand, it generates irregular pressure drop domains along the fractures in the other models. There is no large difference in effects of the shaft excavation in "Moderately fracture zone" between the homogeneous model and the other models.
No effect of the shaft excavation extends to the north side of the fault until the shaft penetrates the fault. After the penetration, a pressure drop domain forms on the footwall side (north side) of the fault. The extent of the effect depends on the distribution of fractures. The present simulation indicates that an "equivalent continuum model" (model which takes the heterogeneity into consideration) has a more restricted extent of the effect. It probably results from the discontinuity of hydraulic conductivity.
The "equivalent continuum model" allows reflecting the fracture distribution (direction, density, size and permeability) to the hydrogeological. Therefore, "equivalent continuum model" can reproduce well the barrier effect of the Tsukiyoshi Fault, and is applicable as a methodology for evaluating the groundwater hydrology of a several-kmseveral-km area.